

Great market research isn't just about gathering data; it's about asking the right questions to get answers that actually steer your business. It's a process: you start by figuring out what you need to know, pick the right way to find it, make sense of the information, and then—most importantly—turn those insights into action.
Setting the Stage for Smarter Decisions

Before you even think about launching a survey or digging into a competitor's website, you need to pause and define what you really want to learn. Good research isn't a fishing expedition for interesting stats; it’s about making confident, well-informed decisions that move the needle.
Without a clear goal, you’ll end up with a mountain of data that’s interesting but ultimately useless. You’ll waste time, money, and energy.
This first step is your anchor. It’s what turns a vague goal like "we need to sell more" into a sharp, answerable question like, "What are the biggest frustrations our ideal customers face that our competitors are completely ignoring?" A focused question like that ensures every bit of effort that follows is purposeful.
The value of this approach is undeniable. The global market research industry exploded from $71.5 billion in 2016 to an estimated $140 billion in 2024. That's nearly double in just eight years, which shows just how essential these insights have become for businesses to stay competitive.
From Vague Goals to Sharp Questions
The trick is translating your big-picture business objectives into precise questions that research can actually answer. This is where clarity comes from. A well-crafted question is your compass, guiding everything from the methods you choose to how you analyze the results.
Here's how to turn common business goals into focused questions that guide your research.
This table shows how a simple shift in framing can create a clear path for your research efforts, ensuring the answers you get are directly tied to a business outcome.
A research project without a clear objective is like a ship without a rudder. You’ll drift with the currents of interesting but irrelevant data, never reaching a destination that drives real business impact.
Defining Your Core Objectives
Your research objectives need to be specific, measurable, and realistic. The best way to start is by asking yourself, "What decision do I need to make with this information?"
Are you trying to decide whether to enter a new market? Do you need to refine your pricing? Or are you trying to figure out why a competitor is suddenly stealing your customers?
Once you know the decision you need to make, you can build your objectives around it. For example, if you're thinking about a rebrand, your objectives aren't just "to see what people think." They should be much more concrete:
- Measure current brand perception among our target demographic.
- Identify which brand attributes connect most with potential customers.
- Test three new logo concepts for clarity, appeal, and memorability.
This level of detail is a non-negotiable first step. To see how this plays out in a real-world scenario, you can explore our guide on using branding market research for real growth. By setting clear, achievable goals from the very beginning, you guarantee that every piece of data you collect has a purpose.
Choosing Your Research Toolkit
Once you know what you need to find out, it's time to figure out how. Effective market research comes down to picking the right blend of two core approaches: primary and secondary research. Think of them as two different lenses to view your market—one gives you the big picture, and the other zooms in on the fine details.
Secondary research is where you start. It’s about digging into information that already exists, like industry reports, government statistics, and competitor deep-dives. This is the foundation you build on.
Primary research, on the other hand, is brand new data you collect yourself. This includes things like surveys, one-on-one interviews, and focus groups, all designed to answer your specific questions.
The real magic happens when you use them together. You start broad with secondary research to get the lay of the land, then you go deep with primary research to get answers nobody else has.
This combined approach has never been more important. The market research sector was valued at a staggering $84 billion by the end of 2023, a significant jump from $76.37 billion in 2021. This growth is driven by the sheer volume of consumer data out there, making a smart, strategic approach essential.
Primary vs. Secondary Research in Action
Let's say a SaaS startup has an idea for a new project management tool. Here’s how they could tackle the research:
- First, Secondary Research: They'd start by digging into free government data on small business growth and read industry reports on the current project management software market. This quickly confirms the market is huge and growing, but also incredibly crowded.
- Then, Primary Research: Armed with that context, they set up one-on-one interviews with project managers at small companies. They don't ask, "Would you buy our tool?" That's a leading question. Instead, they ask about the daily frustrations and workarounds they deal with using their current software.
This combination is smart and efficient. The secondary data validated the market opportunity without costing a dime, while the primary interviews uncovered specific feature gaps and pain points competitors were completely ignoring. Just like that, they found their entry point.
To really get a handle on all the options available, it's worth exploring the various research methods and sociological methodologies that form the backbone of these studies.
The image below shows how this all flows together logically, from setting your goals to picking the right method and crafting your questions.
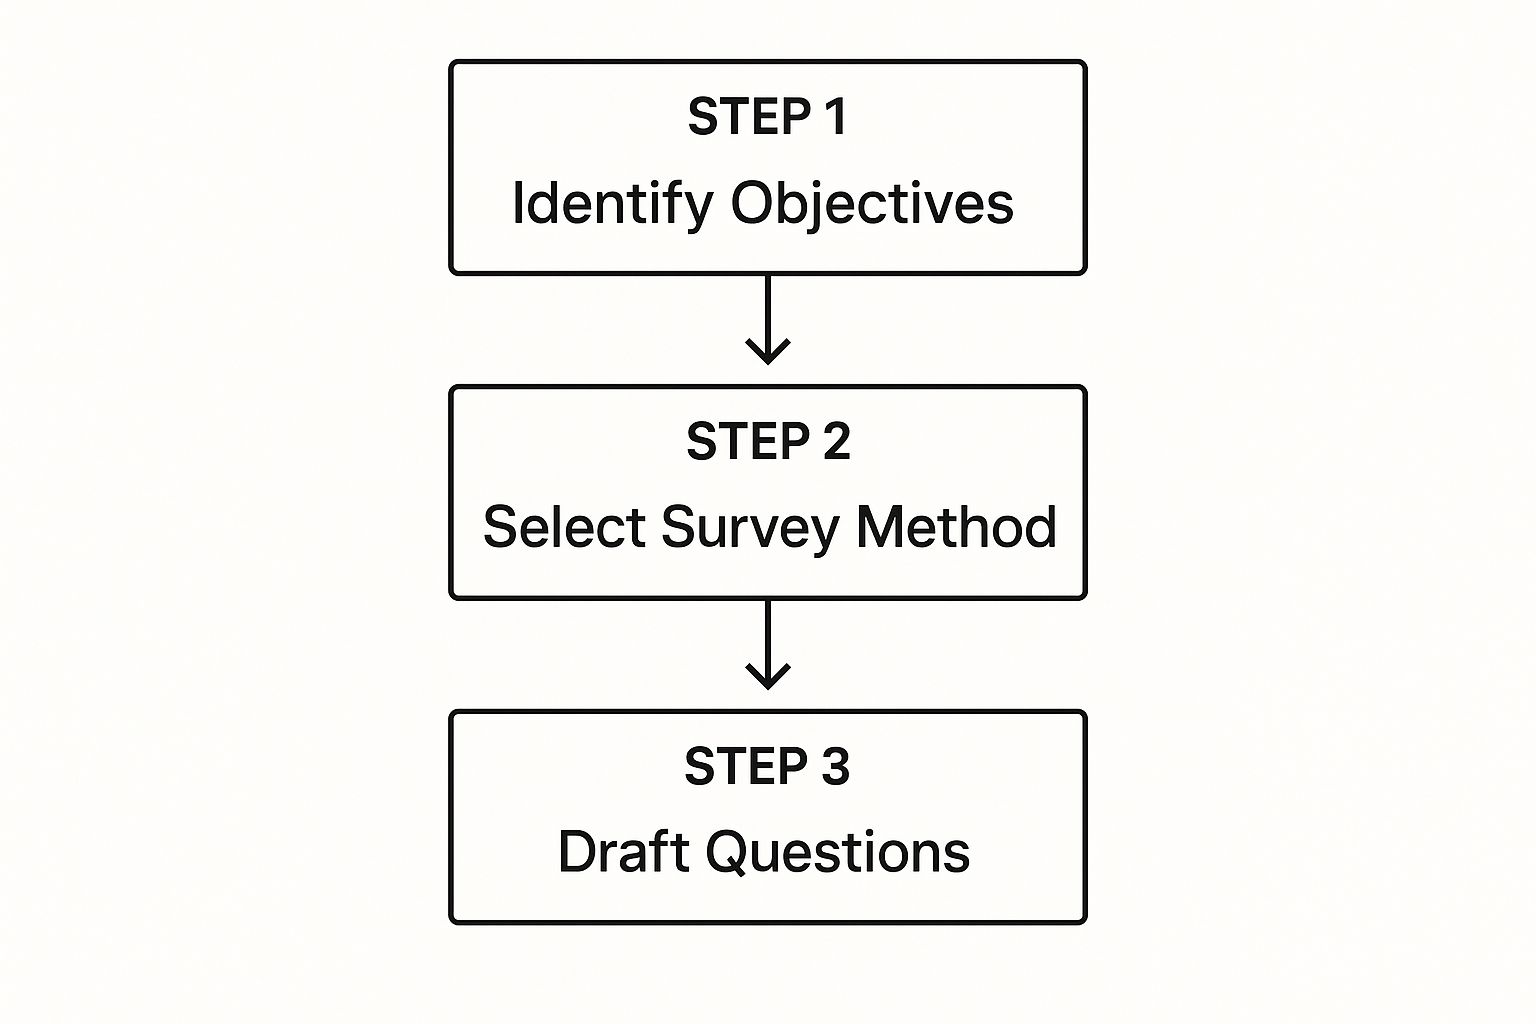
As you can see, your objectives should always be the driving force behind your research methods, which then naturally inform the questions you ask.
Picking the Right Tool for the Job
When you get to the primary research stage, you'll often face a choice between two workhorses: surveys and interviews. Knowing which one to use—and when—is the key to getting the insights you need without burning through your budget.
Use surveys to answer the "what" and "how many." Use interviews to uncover the "why." Getting this right will make your research efforts dramatically more effective.
To help you decide, here’s a straightforward comparison of the most common research methods.
A Practical Comparison of Research Methods
Each of these methods has a clear purpose. A survey can tell you that 70% of users find your checkout process "difficult." That’s a crucial signal.
But it’s the follow-up interviews that will reveal why it's so difficult. Is the "continue" button poorly placed? Are the payment options confusing? One method flags the problem, while the other tells you the story behind it. Choosing the right tool for the right moment is what separates good research from great research.
Putting Your Data Collection Plan into Action

Alright, this is where the rubber meets the road. You’ve done the strategic thinking, you’ve picked your methods, and now it’s time to start gathering the information that will shape your brand's future. How well you handle this part makes all the difference between collecting a jumble of noise and uncovering truly valuable insights.
Let’s be clear: the quality of your data is everything. It doesn't matter how much information you collect; if it’s poorly gathered, it will point you in the wrong direction. That means being meticulous about how you design your surveys, who you’re talking to, and maintaining ethical standards from start to finish.
Designing Surveys People Actually Finish
We’ve all started a survey only to bail out halfway through. They’re often too long, confusing, or just plain boring. The trick is to create something that’s easy to get through and respects the person's time.
Most people will give you about 10 minutes before their attention wanders and they close the tab. Anything longer, and you risk getting incomplete or rushed answers. Keep it focused.
To make sure your survey actually brings back useful data, stick to a few core ideas:
- Set the stage. Start with a quick, friendly intro explaining what the survey is for and how long it should take. Let them know their input is valuable and their answers are private.
- Keep it simple. Use plain language. No one wants to decipher corporate jargon or overly complicated questions. Ask about one thing at a time.
- Create a natural flow. Group similar questions together. I like to start with the easy, general stuff before getting into the more specific or detailed questions.
- Don’t lead the witness. A question like, "Don't you agree our new feature is amazing?" is just fishing for compliments. A much better way to phrase it is, "How would you describe your experience with our new feature?" It leaves room for an honest answer.
This approach helps you gather genuine feedback, not just confirmation of what you already believe.
Mastering the Art of the Interview
While a survey can tell you what people are doing, a good interview reveals the why. A great interview should feel more like a conversation than a quiz. Your main job is to listen and gently guide the chat to dig into their experiences, thoughts, and feelings.
The secret is asking open-ended questions. Avoid anything that can be answered with a simple "yes" or "no." Instead of asking, "Do you like our product?" try something like, "Can you walk me through the last time you used our product?" This encourages storytelling, which is where the richest insights are found.
When you're in the thick of an interview or focus group, it's easy to miss key details. Using effective note-taking methods is a game-changer for capturing those subtle nuances and direct quotes that become so important later on.
The most powerful insights often come from the follow-up question you didn't plan to ask. Pay close attention to unexpected comments and don't be afraid to ask, "Can you tell me more about that?"
Finding the Right People: The Basics of Sampling
You can't talk to your entire market, so you have to be smart about who you choose. Sampling is just the process of selecting a smaller group that represents the larger audience you're trying to understand. Get this wrong, and your findings won't be credible.
First things first, you need a crystal-clear picture of your ideal customer. If you’re a bit fuzzy on this, now’s the time to nail down how to define a target market. For example, if your product is for freelance graphic designers, your sample needs to be exactly that—not just any designer or any freelancer.
Here are a few ways to build your sample:
- Random Sampling: Everyone in your target group has an equal shot of being picked. This is the best way to get statistically accurate results, but it can be tough to pull off in the real world.
- Stratified Sampling: You divide your audience into subgroups (like age, location, or experience level) and then pick randomly from each group. This ensures you hear from all the important segments.
- Convenience Sampling: You talk to people who are easy to reach. It’s fast and cheap, but be warned—it's prone to bias. This is best used for early, exploratory work, not for making big decisions.
Sample size is also a key factor. For qualitative work like in-depth interviews, you can start seeing patterns with just 10-15 people. For a survey to have any statistical weight, you'll need a much larger group, often hundreds of respondents.
Upholding Ethical Standards
When you conduct research, you have a responsibility to the people who give you their time and thoughts. This isn't just about ticking boxes; it's about building trust and ensuring the integrity of your work.
Always be upfront. Participants have a right to know who you are, why you’re collecting their data, and how you plan to use it. Getting their informed consent is an absolute must. This means they freely agree to participate because they understand what they’re signing up for.
Protecting their privacy is equally important. Remove names and other personal details from your data whenever you can. Reassure people that their individual answers will be kept confidential and that you'll only report on the findings as a whole. Taking these steps not only protects your participants but also strengthens the credibility of your entire project.
Finding the Story Within Your Data
Collecting all that data is a huge step, but honestly, it’s only half the battle. The real magic happens when you start digging into the numbers and notes you’ve gathered to find the story hidden inside. This is where you turn a pile of raw information into a clear narrative that can steer your biggest business decisions.
And don't worry, you don’t need to be a data scientist for this part. The goal isn’t to build some complex statistical model; it’s about spotting the patterns, themes, and those "aha!" moments that scream for attention. Once you have your data in hand, the real work begins: uncovering the insights, often by mastering search query analysis and other smart interpretation methods.
Making Sense of Your Quantitative Data
Quantitative data—the hard numbers from your surveys, analytics, or sales reports—is fantastic for answering the "what" and "how many" questions. The easiest way to get started is to simply plug it all into a spreadsheet.
Begin by looking for the big, obvious trends. Did one marketing channel completely outperform the others? Is there a specific point in your checkout process where everyone seems to be dropping off? Use basic functions like SUM, AVERAGE, and COUNT to organize your results. From there, create some simple charts or graphs. You’d be amazed how quickly patterns jump out when you can actually see them.
For instance, a quick bar chart might reveal that 75% of your negative customer feedback comes from people using a specific mobile device. That’s not just a stat; it’s a giant red flag telling your product team exactly where to focus their energy.
A single, well-visualized data point can be more powerful than a hundred-page report. I once worked with a startup that noticed customers who rated their onboarding as "excellent" had a 40% higher lifetime value. That one insight led them to completely overhaul their new user experience, which directly boosted revenue.
Uncovering Themes in Your Qualitative Data
Now for the fun part: qualitative data. This is all the rich, descriptive feedback from interviews and open-ended questions where you discover the "why" behind the numbers. Yes, it’s messy and unstructured, but this is where the real gold is buried. The best way to tackle it is with a technique called thematic analysis.
It sounds more complicated than it is. It's really just a straightforward process of grouping similar ideas together.
Here’s a simple way I like to do it:
- Just Read: First, read through all your interview notes and survey responses once without taking notes. Just get a feel for what people are saying.
- Start Coding: Go through it all again, but this time, highlight interesting quotes, pain points, or suggestions. Create short labels (or "codes") for each one, like "confusing navigation" or "loves fast support."
- Find Your Themes: Now, look for patterns in your codes. You might notice that "confusing navigation," "can't find the search bar," and "the menu is a mess" all point to a much larger theme of "Poor User Experience." Group these related codes together under that bigger idea.
- Review and Refine: Take a step back and look at the themes you've created. Do they accurately tell the story of your data? You should end up with three to five powerful themes that truly summarize what your customers are thinking and feeling.
This process transforms dozens of individual comments into a handful of clear, actionable insights you can actually do something with.
Blending Both Worlds for a Complete Picture
The most powerful insights almost always come from combining your quantitative and qualitative findings. The numbers tell you what is happening, and the stories from your customers tell you why. They validate and add color to each other, giving you a complete, three-dimensional view of your market.
Let’s see how this works in the real world.
This synthesis is where raw data becomes a strategic asset. By piecing together the numbers and the narratives, you move beyond just observing what’s happening and start to form a clear, compelling story. A story that not only explains the present but shows you the best path forward. This is how you do market research that actually drives your strategy.
Turning Insights into Actionable Strategy

All the market research in the world is worthless if it just gathers dust in a forgotten folder. This is where the real work begins—turning your hard-won findings into a strategy that actually moves the needle. It's the moment you connect your research directly to business results.
At this stage, your job shifts from researcher to storyteller. You have to weave all those data points, customer quotes, and market trends into a narrative that gets people to listen and, more importantly, to act. A dry report stuffed with charts and tables won’t cut it. You need to show your stakeholders the way forward.
Building Your Narrative
The most effective way I've found to present research is to frame it as a simple story: a clear beginning, middle, and end. It’s far more persuasive than dumping a pile of data on someone's desk. This approach walks your audience through your process, helping them understand not just what you found, but why it’s a big deal.
Break your presentation down into three parts:
- The Situation: Start by reminding everyone what got this whole project started. What was the business challenge or question we set out to answer? This grounds everyone and sets the stage.
- The Discovery: This is the heart of your story. Unveil your most critical findings—the real "aha!" moments. Use simple, bold visuals to make the key stats impossible to miss.
- The Recommendation: This is your closing argument. Based on everything you've shown, what should we do next? Each recommendation must be a direct, practical solution to the initial problem.
This simple structure shifts the entire conversation from "Here's some interesting information" to "Here's what we need to do, and why."
The goal of a research presentation isn't just to inform; it's to persuade. Your final report should be a clear and compelling argument for change, with every key finding serving as evidence to support your recommended strategy.
Visualizing Data for Maximum Impact
People remember what they see. When it comes to making your insights stick, simple charts and graphs are your best tools. You don't need to get fancy with complex visualizations; often, the simplest ones are the most powerful.
Think about it: a pie chart showing that 80% of customer complaints come from a single product feature lands with an immediate thud. A line graph showing a steep drop in user engagement right after a website update tells a story on its own, without a word of explanation.
The key is clarity. Every chart should make a single, powerful point. If you try to cram too much into one visual, you’ll just confuse your audience. Let your data do the talking and use visuals to give it a louder voice. This turns abstract numbers into concrete proof that demands attention.
A Real-World Example of Insight in Action
Let’s look at a quick scenario. Imagine a B2B software company was struggling with a sales cycle that kept getting longer. They were losing deals that, on paper, they should have been winning.
- The Findings: They talked to their customers and prospects. What they discovered was that while their software was powerful, the marketing message was a confusing mess. Potential buyers couldn't connect the product to their real-world problems. The company was talking about features, but customers were desperate for solutions.
- The Pivot: This insight triggered a complete overhaul, not just a few tweaks. They created new case studies focused on results, rewrote ad copy using actual quotes from happy customers, and retrained the sales team to stop listing features and start solving problems.
- The Result: In a single quarter, their sales cycle shortened by 20%. Their demo-to-sale conversion rate jumped. The research didn't just give them interesting data; it handed them a clear roadmap to fix a major business problem, leading directly to more revenue.
This is exactly what you're aiming for. The insights you uncover should shape your company's direction. By turning data into a story and that story into a strategy, you prove the immense value of market research. The logical next step is understanding how to develop a brand strategy and applying these insights for long-term growth.
Answering Your Top Market Research Questions
Even the best-laid research plans run into practical questions. It’s just part of the process. I’ve seen these same hurdles pop up time and time again, so let's walk through the most common ones. Getting these right will keep you on track and make sure your findings are solid.
How Much Should I Budget for Market Research?
Ah, the million-dollar question—or hopefully not! Honestly, there’s no single price tag. I’ve seen projects done for next to nothing and others that cost tens of thousands of dollars. It really all comes down to the methods you choose.
- DIY Secondary Research: This is your starting point, and it’s often free. Digging into government reports, industry publications, and existing studies costs you time, not money.
- Surveys: You can get going with online survey tools pretty affordably. The real cost comes when you need to recruit a specific audience. This can run anywhere from a few hundred to several thousand dollars, depending on how niche your audience is and how many people you need.
- In-Depth Interviews & Focus Groups: This is where the budget can climb. You have to account for incentives to thank people for their time (usually $50-$150 per person), a professional moderator, and maybe even transcription services.
A startup just trying to get a feel for the market might get by with free data and a small survey for under $500. On the other hand, a big company launching a new product could easily spend $20,000 or more on a series of focus groups.
My advice? Start small. Use what’s freely available to get your bearings. Then, set aside a modest budget for a targeted survey. The insights you get from that first real step will tell you if it's worth investing more in deeper, qualitative research.
How Many People Do I Need to Survey?
This is a classic. The answer really depends on what you're trying to achieve. Are you just looking for a general direction, or do you need a number you can bet the farm on?
For qualitative work like one-on-one interviews, you'd be surprised how quickly patterns emerge. You’ll often start hearing the same themes after just 5 to 10 conversations. Here, the goal isn't a statistically perfect sample; it's about rich, deep understanding.
Quantitative surveys are a different ballgame. A sample size of 30 might give you a faint signal, but a group of 100 gives you a bit more confidence. If you need results that you can confidently say represent a much larger population, statisticians will tell you to aim for 400. But for most business decisions, a well-chosen group of 100-200 respondents gives you plenty of clarity to make your next move.
How Do I Avoid Bias in My Questions?
This is so important. If your questions aren't neutral, you're just collecting skewed data that confirms what you already think. Biased questions can subtly push people toward a certain answer, and that makes your results pretty much useless.
The biggest mistake I see is asking leading questions. For example, don’t ask, "How much did you enjoy our amazing new feature?" That assumes they enjoyed it. A much better way to phrase it is, "How would you describe your experience with our new feature?"
Another trap is using loaded words. Words like "innovative" or "clunky" come with built-in judgment. Stick to plain, descriptive language and let your participants supply the opinions. Here’s a pro tip: always have someone who isn’t involved in the project read over your questions. A fresh pair of eyes can spot bias you’re too close to see.
At Softriver, we don’t guess. We build deep market research into our branding process to make sure your new identity isn't just a pretty face—it's strategically built to connect with your audience. Get a brand that connects with your customers today.